BTC Logarithmic Curve
THEORY
— I never understood why most students needed to learn what a Log was until I’ve studied a BTC chart.
— A Log curve in simple term goes 0 to .99999999
— It never touches 1. It is infinite. Meaning it goes forever always getting closer to 1.
— My assumption is that BTC will become stable one day. It may take many more halving’s for that to happen.
— With that being said, that’s why BTC is an excellent investment opportunity in the year 2020. (Of course with a proper bottom entry)
— Each halving comes a significant reduction of ( RIO ) Return On Investment.
CHART
— After many hours of studying this chart. I observed a pattern. BTC usually switches trends yearly on the macro level.
— I base that theory on this chart. If historical evidence does in fact repeat then my theory analysis will be true.
— I like to think of this chart of like playing darts w/ a blindfold on. It is a million dollar question.
OPPOSING VIEW
— Many say BTC is in a Wyckoff pattern. » Fill the gap»
I tend to believe that Bitcoin will revolutionize the world the same way the internet has been able to. I will remain optimistic because I believe in the technology.
Like & drop a comment on what you think will happen.

Related Ideas

Comments


While I agree that Bitcoin has the potential for further logarithmic growth, you’re understanding of log charts is incorrect. You are in fact throwing darts with a blindfold on in a way.
The difference between a log chart and a linear chart is simply the scale of the Y-axis. A linear chart’s scale is distinct and each point represents an equal amount, while a logarithmic chart spreads the value out as if it were approaching infinity. That in no way implies that the asset being measured is forever is getting closer to it’s infinite bound. A log chart simply scales from zero to the upper limit value («approaching» infinity); but infinity is arbitrary and depends on the chart.
There is absolutely no correlation between an asset’s price and whether you’re using a log or linear chart, it is a scale; nothing more than a tool to display a value with a large relative change between it’s high and low in a more user-friendly way. Due to the scaling, a log chart will always make an asset look as if it is becoming more stable, because as you go higher up the Y-axis of the chart, the intervals get smaller and smaller. If you’re assuming that BTC will stabilize based on a log chart, you’re being fooled by the scale which, by itself, is NOT an accurate portrait of volatility.
Also, the halving does not reduce ROI. It only reduces the incoming supply of BTC, nothing more. Market forces determine what happens to the price, halving or no halving, as we can see even your «consolidation» periods show pretty aggressive growth.
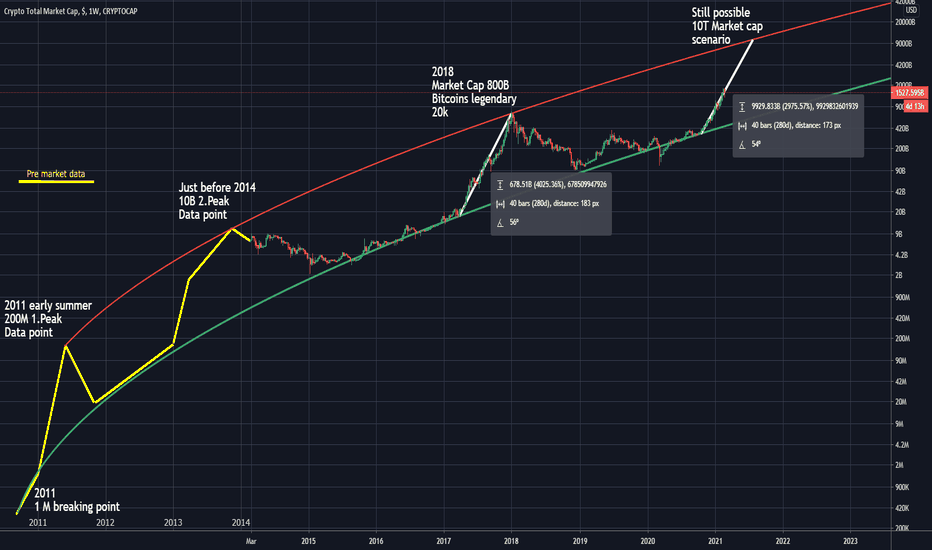
Your «consolidation» between November 2011 and November 2012 is actually a bull run with a 400% price increase; Jan 2015 to Jan 2016 represents a 200% bull run, and Jan 2019 to Jan 2020 a 300% increase in price. The yellow areas actually indicate an INCREASE in volatility in 4-year cycles.
The bull trend you have starting in 2020 looks like a bull run, it is only represents a 27% increase in price so far. Since the scale isn’t linear, early price movements look extremely exaggerated compared to later ones. If we were to just make a prediction based on the fact that it’s a log chart and without any knowledge of what’s being measured, it would appear that the curve is flattening and approaching a 10-year peak around $20k
If you don’t really understand the scale, looks can be deceiving. There are definitely very distinct bear trends representing a
85% decrease in price roughly one year after every halving. Each halving has sparked a bull run that saw an 8000%, 2500%, and (so far) 30% increase in price respectively.
According to the pattern, this current bull run should give us a 1000% increase from last halving price, meaning a price of $94,500 by May 2021 (assuming the curve isn’t flattening to $20k).
Источник
LOGARITHMIC
Predictions and analysis

I thought it was time to make a longterm chart, with all these wrong charts going around, hehe. They are wrong because bitcoins support and resistance lines are NOT linear in the logarithmic chart. I think that the correct fit is a square root function in the logarithmic chart, meaning that the growth is slowing down on long timescales. BTC cannot just continue.

A logarithmic look at the evolution of BTC price since its very early days The following key takeaways: BTC tends to extend only about 1/5 of its prior impulse move measured in terms of % increase; BTC tends to react ≈38.20% on a logarithmic scale to form a correctional bear market; The sub $80k area is a pivotal area to look for supply inflows. This.

While BTC has dipped back down recently, we are still very much on track. In fact, we are still fairly far ahead with regards to our «fair value» logarithmic regression support band, fit to «non-bubble» data. This market cycle will likely be a long one, so buckle up for the journey, and maybe one day BTC will flirt with the upper «peak» logarithmic regression.

Experimenting with Bitcoin high time frame log charts, I began to notice some patterns. Please note: This is a work in progress and by no means financial advice. Highlighted in yellow are two box areas, the rest is built around them. The similarity appears striking, imo. Does this mean the chart will continue to produce and follow these patterns? Log charts are.
Found more early market data and tried some colouring.. Have to convince oneself after few days downhill, remember The Big Picture.

Using a non-linear logarithmic regression, we can project the price of Bitcoin towards the future. Seems consistent with the Stock to Flow price and reveals much more upside as time goes forward.

BITCOIN Logarithmic long term!!

Here we take a look at BTC heikin-ashi candles on a 3 day timescale, the 1 day simple moving average with a length of 300, and a fibonacci channel, all on the logarithmic price scale. Of note, is the candle behavior in relationship to the 300 SMA, before and after BTC reaches its’ peak during the 2013 and 2017 bullruns, and how that behavior can be analyzed.

THEORY — I never understood why most students needed to learn what a Log was until I’ve studied a BTC chart. — A Log curve in simple term goes 0 to .99999999 — It never touches 1. It is infinite. Meaning it goes forever always getting closer to 1. — My assumption is that BTC will become stable one day. It may take many more halving’s for that to happen. -.

I have fit the weekly logarithmic regression and used 20/50/100/200 MA indicator for ETH. For a bullish trend, I expect to see a double cross on the MAs, with the 50 and 100 both crossing the 200, followed by steady separation of ordered MAs (green yellow orange red) from top to bottom.

I think the bull run isn’t over, however there is a small probability that the $65K was the top and we are all on the denial phase now. Remember market act as its own and in most cases acts the opposite of the herd, — Most is expecting the bull market not to be over — Most was expecting a blow off top If $65k was not the top here is my outlook for bitcoin moving.

Consider taking some profits in the coming summer.. there will be bear year after this run. Also possible altcoin fluctuation, maybe possible to make gains after bitcoin has reached its peak. But everything will fall drastically after semester. Sorry strange english, my native finnish brains make Ralli-finglish sentences.

This is a Log scale chart on BTC/USD from Bitstamp. Utilizing fib channels with 618 extensions, trend based fib time, and regular fib extensions.

So yes, BTC is apparently bullisher than I thought, at least short-term, because longterm I’m always a BTC uber bull 🙂 But short-term, I had several reasons to think that a weekly capitulation bar was very likely: 1. Too much bullishness and optimism (contrarian indicator) 2. Number of daily transactions still below ATH (although now finally approaching ATH.

Hello everyone, I sketched an approximate price movement on a logarithmic chart.

In this chart I have used logarithmic regression to identify cycle tops and bottoms in BTC. Using the hypothesis of lengthening cycles, I have 3 price targets for a cycle top in mid-to-late 2022. With the current weighting of my regression, it shows that BTC is undervalued right now, with the fair value shown using a blue line.

With all that doomsday feeling going around, I thought I’d update my older longterm chart, with updated, more precise price action. It still seems that the bottom will be in the low 2000s area, sometime in march/april 2019, then a longer flat period, before the next bullrun. This time, I looked at the ratio of the previous ATHs to each other, the factors are.

Looking at the current BTC downward market structure in log, here are some observations. Purple fan lines extend from last year March low. The white channel fits perfectly between the two most outreached tops, and 4 bottom major wicks down since April. Most recent local wick down landed on the bottom of the triangle (log) and local structure .618. Major trend.
Источник
LOGARITHMIC
Индикаторы и стратегии

Another in a series of experimental indicators using logarithmic scale visualisation. This one extends into some work on I’ve been doing on ‘the cube’, but Pine isn’t liking multiple log lines even when the equations are included for each plotted variable, meaning, no variables used in the definition of a variable, as is done here. As a result, accuracy of this.

Repulsion: Price & Volume 1 www.quantamagazine.org Proof of concept using the above link and comparisons of price and volume, and one of a series stemming from the so-called Repulsion Engine, now also open sourced, and other indicators from the workbench. Traffic lights are not.

This script is a combination of different logarithmic regression fits on weekly BTC data. It is meant to be used only on the weekly timeframe and on the BLX chart for bitcoin. The «fair value» line is still subjective, as it is only a regression and does not take into account other metrics.

Logarithmic regression of the USD price of Bitcoin , calculated according to the equation: y=A*exp(beta*x^lambda + c) + m*x + b where x is the number of days since the genesis block. All parameters are editable in the script options.

The «Zero Line» is the calculated logarithmic regression of Bitcoin over the last decade. The rainbow above the Zero Line are the Fibonacci multiples from 0 —> 1 of the log regression (0.236, 0.382, etc.) The rainbow below the Zero Line is identical, except that the multiples are negative (-0.236, -0.382, etc.) For the first time ever, Bitcoin broke through the.

This a companion indicator for the Bitcoin Logarithmic Growth Curves indicator. This is an oscillator version of the above. When the indicator is at / near 1 then Bitcoin price is at / near the upper range of its long-term logarithmic growth trend. When at / near 0 then price is at / near the lower range of that trend. This indicator only works with the BLX.

I found this awesome script from @quantadelic and edited it to be a bit more legible for regular use, including coloured zones and removing the intercept / slope values as variables, to leave space for the fib levels in the indicator display. I hope you all like it.

Logarithmic regression (or known as Tseng’s tunnels), is used to model data where growth or decay accelerates rapidly at first and then slows over time. This model is for the long term series data (such as 10 years time span). The user can consider entering the market when the price below 25% or 5% confidence and consider take profit when the price goes above 75%.

This code is a slightly modified version of Tradingviews’ built-in «linear regression» script which can be correctly plotted on logarithmic charts.

The main concept was to make a bound oscillator calculate with a formula that places emphasis on the mean averages. Ideally this would mean that the oscillator won’t have a tendency to swing into overbought/oversold condition and cause whipsaw. Using log is a way to increase the signal to noise ratio, with the regular MFI still plotted. This indicator is best.
Источник